A comparison of mainstream and special education for teenagers with Down syndrome: Implications for parents and teachers
This article presents data from a research study designed to compare the achievements of teenagers with Down syndrome educated in mainstream classrooms or in special education classrooms throughout their full-time education. Progress is reported for speech and language, literacy, socialisation, daily living skills and behavior. For all the teenagers, there is evidence of progress with age on all the measures except for communication. Communication continued to improve through teenage years for the included children but not for those in special education classrooms. There were no significant differences in overall outcomes for daily living skills or socialisation. However, there were large significant gains in expressive language and literacy skills for those educated in mainstream classrooms. Teenagers educated in mainstream classrooms showed fewer behavioral difficulties. Further, comparison with data published by these authors in an earlier study, showed no improvements in school achievements in special education over a 13 year period in the UK (1986-1999).
Buckley, S, Bird, G, Sacks, B, and Archer, T. (2006) A comparison of mainstream and special education for teenagers with Down syndrome: Implications for parents and teachers. Down Syndrome Research and Practice, 9(3), 54-67. doi:10.3104/reports.295
In 1987, two of the authors of this article published information on the development and lives of a large and representative group of 90 teenagers with Down syndrome. [1] In some ways, the progress of the teenagers was disappointing - very few had made any useful progress at all with reading, writing, number and money, and social independence skills such as crossing roads and traveling alone were very limited. Most led rather isolated social lives and only 42% had speech that was intelligible to those meeting them for the first time (for example in a shop or café). The authors commented that their findings should not be taken as indicating what teenagers with Down syndrome could achieve, but rather, that the findings may be due to the nature of the curriculum in special schools, low academic expectations, being bussed out of their own communities every day to school and social attitudes which did not allow children with Down syndrome into clubs and activities in their communities. In 1987 94% of the teenagers were in schools for children with severe learning difficulties (SLD), 6% in schools for moderate learning difficulties (MLD).
In 1988, as a result of this study and in line with legislative change towards inclusion in education in the UK, the Portsmouth team began to develop inclusive education in local mainstream schools for the children with Down syndrome starting school in the southeast part of the county of Hampshire. In the rest of the county most children with Down syndrome continued to be placed in special schools. Down Syndrome Education International funded a psychologist to work with the schools, parents and the Education Authority to develop successful inclusion. This work has provided a unique opportunity to compare the outcomes of special versus mainstream education for two groups of children with Down syndrome of similar backgrounds and ability. It enables us to test out our view that the teenagers in 1987 were underachieving and socially isolated as a result of segregated special education. Are the teenagers who have been included in mainstream education showing the predicted benefits of going to school with their typically developing local children?
Specifically, we hoped that included children would be more likely to have friends in the neighborhood and better social lives as teenagers, with better social independence skills for getting around their communities, more friends and more involvement in clubs and activities, that their speech, language, behavior and social development would benefit from being with typically developing peers and that their academic achievements would improve. Does the evidence demonstrate these benefits?
In 1999 we repeated the survey [2] that we had carried out in 1987 with the current group of teenagers, including some additional measures. This enables us to compare the benefits of mainstream and special education for the 1999 teenagers and also to ask if, as a group, they are benefiting from changes in social attitudes and better education when compared to the 1987 teenagers.
Many of the results of the study were not as the researchers might have predicted, and the findings raise some important issues for parents and educators of teenagers with Down syndrome to consider.
The 1999 study
In 1999, information was collected for 46 teenagers, 28 in special schools (24 in SLD and 4 in MLD schools) and 18 in inclusive schools. The young people in the two groups were placed in mainstream or special schools on the basis of where they lived; they were from similar social and family backgrounds and were likely to be of similar potential abilities when they started school. The results we report are unlikely to exaggerate any advantages of inclusive education for the following reasons.
1. When we compared the progress of the two groups, to ensure that we were comparing young people of potentially similar abilities, the 5 'least able' teenagers from the special schools were taken out of the comparison group, before the two groups were compared. These 5 'least able' teenagers are those with significantly more developmental delay and health problems than the rest of the group. Two of them have autism in addition to Down syndrome and 3 of the 5 have significantly high rates of difficult behaviors. These young people have had multiple difficulties since childhood, and children with this level of difficulty would not have been placed in mainstream classes in any part of the county at the time of the study.
2. The average age of the mainstream group is two years younger than the average age of the special school group. This would reduce the likelihood of finding higher scores on any measures for the total mainstream group, as we know from our 1987 study that the teenagers in all groups are likely to be progressing with age on the measures we used.
Full details of the samples used in the comparisons are used in Appendices 1 and 2.
It is also important to note that the teenagers in the mainstream schools have been fully included in age-appropriate classes in their local schools, supported by a Learning Support Assistant for the majority of the day. They have not been in special classes or resource rooms in mainstream schools and, usually, they have been the only child with Down syndrome or a similar level of learning difficulty in school until they reached secondary schools. In secondary school, some have continued to be the only teenager with Down syndrome, but some have been with one or two others with Down syndrome.
In both 1987 and 1999, the information was collected by surveys. In both studies, parents completed a questionnaire designed by the authors, the Sacks & Buckley Questionnaire (SBQ). In the second study, additional standardised questionnaires were also used, the Vineland Adaptive Behaviour Scale (VABS) [3] and the Conners Rating Scales (CRS). [4] The two main questionnaires (the SBQ and VABS) both contain measures of personal independence skills - Daily Living Skills - which include measures of skills in dressing, toileting, bathing, cleaning, laundry and meal preparation, also time, money, telephone use and road safety. They also both contain measures of speech, language and literacy skills - Communication Skills, and measures of friendship, leisure and social skills - Socialisation Skills. The Vineland Adaptive Behaviour Scale provides normative data which allows scores achieved on the scales to be translated into age equivalent scores. This is useful because it allows us to compare the progress of the teenagers across different aspects of their development. We would expect progress to be even for typically developing teenagers, that is, all skills will be at approximately the same age-level. Previous research suggests that we will find an uneven profile for teenagers with Down syndrome, with Communication skills lagging significantly behind Daily Living and Socialisation skills. The age equivalent scores also allow us to identify the extent of progress with age during the teenage years and this is illustrated in the first set of histograms in Figure 1.
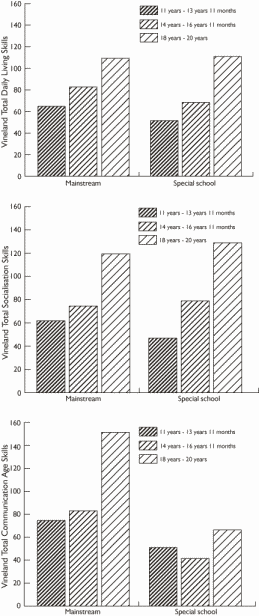
Figure 1 | Progress with age for Daily Living Skills, Socialisation and Communication Skills (group means for Vineland Age Equivalent Scores - 1999 study). See data and analyzes in Appendix 3.
Progress with age
The first two histograms in Figure 1 indicate that Daily Living Skills and Socialisation Skills can be expected to improve significantly as young people with Down syndrome progress through their teens (though with the caution that these figures are for different teenagers in each age group, not the same teenagers as they get older). When we look at the third histogram in Figure 1, for Communication Skills, we see significant progress for the oldest group of mainstreamed teenagers but no significant progress with age for the teenagers in special education. These differences in progress in speech, language and literacy will be explored in more detail in the next section.
The first important conclusion we can draw from this piece of research is that we can expect significant progress in all areas of development during the teenage years. There is no evidence for a 'plateau' being reached, or even a slowing of progress.
The reader will also have observed that there are no significant overall differences in the Daily Living Skills or Socialisation Skills of the teenagers educated in special or mainstream schools, though there is a difference on one measure which contributes to the Socialisation Skills score - the Interpersonal Relationships Scale. This difference may be important and is discussed in more detail in the next section.
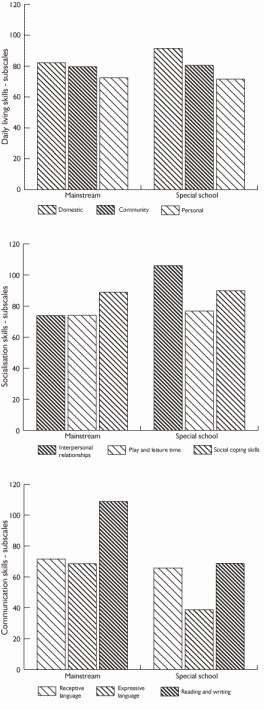
Figure 2 | The relationships between the subscales for Daily Living, Socialisation and Communication skills (group means for Vineland Age Equivalent Scores - 1999 study). See data and analyzes in Appendices 4,5,6.
A more detailed look
For each main scale on the VABS there are 3 subscales which contribute to that score and the information for these subscales is illustrated in Figure 2.
Daily Living
The first histogram illustrates that for Daily Living Skills the teenagers were performing at a similar level in personal and practical skills in the Domestic (e.g. preparing meals, cleaning, taking care of laundry), Personal (e.g. independence in toileting, bathing, dressing) and Community (e.g. staying at home alone, time, money, telephone and road skills) areas. It also illustrates that there were no significant differences in skills between the teenagers in the mainstream or the special school groups.
Socialisation
The second histogram, however, illustrates that for the Socialisation Skills measure there is a difference for the Interpersonal Relationships subscale, which covers social interaction, dating and friendship skills. There were no differences on the Play and Leisure (going to clubs, games, hobbies, leisure activities) or on the Coping skills (awareness of manners, social sensitivity and social rules) subscales.
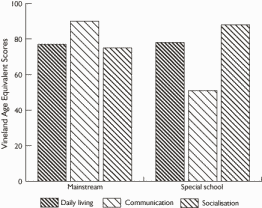
Figure 3 | The relationship between the three aspects of development, Daily Living, Communication and Socialisation (group means for Vineland Age Equivalent Scores - 1999 study). See data and analyzes in Appendix 7.
On the Interpersonal Relationships subscale, the teenagers educated in the special schools scored significantly higher, largely due to differences in scores for the oldest age groups. The older teenagers in special education were more likely to have a boyfriend or girlfriend, a special friend and to belong to clubs than those from mainstream education.
This was the only measure of the many measures used in this research which showed a significantly better outcome for teenagers in special education.
The numbers of teenagers in the study are quite small - 18 in mainstream education and 23 in special education - so that further research is needed to explore the significance of this finding. However, one possibility is that the teenagers in special education have had more opportunity to develop mutually supportive, reciprocal friendships with peers of similar abilities and interests than those included in mainstream schools.
Communication
The third histogram in Figure 2 illustrates the results for the three subscales in the Communication Skills score. For the teenagers in mainstream schools, the results indicate that their receptive and expressive language is progressing at the same rate and that reading and writing is a specific strength and better than might have been predicted from their other language abilities. Their expressive language is 2 years and 6 months ahead of the special school group. Some 78% of the mainstream teenagers are rated as being intelligible to strangers compared with 56% in special schools in 1999 and 42% in 1987. For the teenagers in special education, their receptive language is at a similar level to those in mainstream school but their expressive language is more than 2 years behind their receptive language. Their reading and writing abilities are at the same level as their receptive language but significantly behind the reading and writing skills of the mainstreamed teenagers, the difference being more than 3 years.
It is possible that the improved expressive language of the teenagers in mainstream schools is linked to their reading and writing progress. Researchers suggest that expressive skills are delayed by hearing, speech motor difficulties, auditory memory and auditory processing difficulties. [5-8] Therefore, it may be easier for young people with Down syndrome to learn vocabulary and grammar from written language, than from spoken language. In addition, phonics work plus reading practice may improve speech-motor production skills and speech intelligibility.
The teenagers being educated in mainstream classrooms, with the individual help of a Learning Support Assistant, will have received daily literacy teaching with their typically developing peers. They will also have recorded their learning in all lessons by writing it down and reading it - with whatever level of support was needed to achieve this. Therefore the level of engagement in literacy activities for all the teenagers in the mainstream classrooms will have been much greater than that experienced by teenagers in the special school classrooms.
Overall profiles
In Figure 3 the histograms show the overall results for the main developmental areas - Daily Living, Socialisation and Communication Skills. For the teenagers in the mainstream schools there are no significant differences in the progress being made in each of these areas of development. Communication Skills are good, largely due to their progress with expressive language and literacy. For the teenagers in the special schools, their Communication Skills are significantly delayed relative to their Daily Living and Socialisation skills.
As already noted, this special school profile is, in fact, the one that researchers would expect to see for teenagers with Down syndrome. A number of studies have found that speech and language skills, particularly expressive skills, are specifically delayed relative to both non-verbal cognitive abilities and to social and independence skills. [7,8]
The results of our study suggest that it is possible to bring communication abilities in line with social and practical abilities for teenagers with Down syndrome, by including them in mainstream classrooms. The results indicate that a major factor may be the development of reading and writing and the use of literacy activities to teach and to support spoken language development.
Another major factor may be that the mainstreamed teenagers have been surrounded by typically developing competent spoken language users since they entered preschools at 3 years of age, and this spoken language and communication environment will have been very different to that experienced by the teenagers in the special schools. Almost all of the special school group have been in special schools for children with severe learning difficulties for their entire school career and this means that they have been with children the majority of whom have very significantly impaired language.
Comparison with outcomes in 1987
Perhaps the most surprising and important finding of this study was the lack of progress in special school education between 1987 and 1999 (see Appendix 9). We confidently predicted that all teenagers would be doing better in the 1999 group as we know that the special schools have had higher expectations and more academic programs in the past ten years than they did 15-20 years ago. However, we found no improvements in 1999, when compared with 1987, for spoken language skills, reading, general knowledge and overall school achievement - achievements were the same as in 1987. There were small gains in writing and number.
It is important to remind the reader that the children in the special schools were not less able than the earlier cohort. At the time that these children entered school there was very little mainstreaming where they lived and our data confirms this point, as in many areas of development their skills are the same as both the 1987 group and the 1999 mainstream group.
Our findings suggest that it is not possible to provide optimal learning environments in special schools and classrooms, however hard the teachers work. It suggests that learning within a typically developing peer group may be essential for optimal progress for two main reasons:
1. the typical spoken language of the peer group because this provides a stimulating language learning environment
2. the classroom learning environment and curriculum - the pace of learning has been much greater for those in mainstream because they have been in all academic lessons with individual support for their learning.
We can use the example of literacy to explore this further, the included teenager has had daily literacy lessons with his or her typically developing peers. The classroom curriculum is set for the mainstream children and their learning provides role models for literacy for the student with Down syndrome. He or she will be working with support within the class on individually set targets for literacy. A literacy lesson in a special school classroom will, of necessity, be very different. In the special school, the teacher will have perhaps 6 pupils, all with significant learning difficulties, and will design a literacy activity for this group - 2 of whom may be autistic, two with severe behavior difficulties and 2 with Down syndrome - all have significantly delayed speech and language and only three are able to write their names. Sharing a story together may be an appropriate literacy activity for this group of children, rather than formal literacy instruction. The aim of this example is not to criticise special schools - it is to try and give a real picture of the different demands and resources of the two situations and to try to explain our findings. The same comparison would apply to numeracy lessons in mainstream or special classrooms.
There were no gains between 1987 and 1999 in Daily Living Skills for teenagers in mainstream or special education and significant gains in Social Contacts and Leisure activities for both groups. We suggest that Daily Living Skills are mostly learned at home and therefore not influenced by school placement and, similarly, that the improvement in social inclusion reflects a general change in social attitudes and social acceptance in the community rather than school placement effects. Social lives out of school are also more likely to be influenced by families than schools.
Personality and behavior
Another major area of developmental importance that was looked at in these Hampshire teenage studies was the extent of behavior difficulties, whether any behavior difficulties change with age and if school placement has any influence on behavior.
We were aware from our inclusion support work that difficult or disruptive behavior is a major cause for the breakdown of mainstream school placements. We were also concerned to find out if the demands of coping in a mainstream classroom actually increased behavior difficulties.
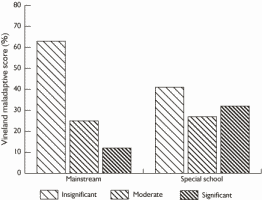
Figure 4 | The significance of reported behavior difficulties (percentage of teenagers in each category)
Significantly difficult behavior affects the learning and social opportunities of a teenager with Down syndrome and can create considerable stress for teachers and for families. Conversely, teenagers who can behave in a socially acceptable and competent manner will be more likely to have friends, to have active social lives and to be successful in work as adults, than those who do not.
Difficult behaviors need to be considered in relation to the helpful and socially sensitive behavior and the positive personalities that are characteristic of most teenagers with Down syndrome. Many references to the positive aspects of teenagers personalities were made by parents during the recent Hampshire survey, for example:-
"J. is a happy and content girl, very understanding, helpful and has a great personality - she brings out the best in everyone."
"He is happy and outgoing and lots of people know him so we talk to more people because of him."
"She is a wonderful, happy and most loved member of our family. She is kind, caring, happy and thoughtful."
"A. has a positive approach to life and brings that to the family. His caring nature and enthusiasm are infectious. I think he has made the family dynamics easier than they would have been, especially the teenage years."
"She is good company, always happy, funny and content."
"Good point is, he is a happy lad who is good fun and has taught us a lot."
"Very loving, trusting and happy boy - enjoys life and is very sociable."
"Our daughter brings more love, fun and laughter to family life and though she will never be 'academic' there are other qualities she has which cannot be measured."
"He is popular, friendly and non-judgemental… he has added another dimension to our lives."
"Brings a lot of happiness to our lives. Her disruptiveness - being rude or awkward - can cause parents and sister to get cross and upset."
The last quote highlights the fact that difficult behaviors occur only sometimes and do not define the person's character. Someone with a positive personality can be difficult at times and this would characterise most of the teenagers in the survey. However, this does not mean the difficult behaviors are not distressing when they do occur and most parents and teachers are pleased to obtain advice on how to handle them.
Several measures were used to collect information about any behavior difficulties that the teenagers had. There were behavior questions on the original Sacks and Buckley Questionnaire [1] and a Maladaptive Behaviour Scale on the Vineland Adaptive Behaviour Scales. [3] In addition, the Conners Behaviour Rating Scale [4] provides measures of several different aspects of behavioral difficulties, hyperactivity, cognitive problems or inattention, oppositional behavior and Attention Deficit/Hyperactivity Disorder-ADHD.
All the measures illustrated that difficult behaviors tend to improve with age for most individuals, with only one teenager over 18 years in the mainstream schools comparison group having even a moderate level of difficulties. This strongly suggests that many of the behaviors reported for the younger teenagers may be linked to general cognitive delays and immaturity.
Our concerns about the demands of mainstream placements increasing behavior difficulties were not confirmed. There was only one measure on which the teenagers from the different school systems scored significantly differently - The VABS Maladaptive Behaviour Scale - and these results are illustrated in Figure 4. The scores can be classified in terms of the severity of the behavior difficulties. As the data below shows, significant behavior difficulties only affect a minority. The teenagers in the mainstream schools were less likely to have difficulties, with 63% having no significant difficulties compared with 41% in the special schools, 25% having a moderate level of difficulties compared with 27% in the special schools and 12% (one in eight) having significant behavior difficulties compared with 32% (one in three) in special schools.
The reader is reminded that the 5 'least able' teenagers in the special schools are not included in this comparison. Three of these 5 had very high scores for difficult behaviors and the remaining 2 had low scores.
This means that in the whole sample of teenagers, and the whole sample is representative of the full range of teenagers with Down syndrome, 26% (one in four) have some significant behavior difficulties which will be probably causing problems at home and at school on a daily basis.
The Vineland Maladaptive Behaviour Scale predominantly includes questions about two main types of behavior, those that may reflect anxiety and nervousness and those that reflect conduct disorder and poor attention.
On the Conners Behaviour measures, which focus on conduct disorders and attention difficulties, there were no significant differences between the levels of difficulties for the teenagers in mainstream or special schools. When the scores of the teenagers with Down syndrome are compared with norms for typically developing teenagers, the proportion of the total group who had serious difficulties was 16% on each of the Oppositional Behaviour, the Cognitive problems/inattention and the ADHD measure and 37% on the Hyperactivity measure. (The reader should note that some 5% of the typically developing population of teenagers of the same age will score in the serious difficulties range as defined by the Conners Scales).
The hyperactivity measures include, being always 'on the go', hard to control while shopping, runs about or climbs excessively in situations where it is inappropriate, restless in the squirmy sense, has difficulty waiting in line or taking turns, has difficulty playing or engaging in leisure activities quietly. The high score here may reflect immaturity and improve with age, as similar findings have been reported by other researchers and interpreted in this way. [9,10]
The link between behavior and poor communication skills
Similar to other studies, and the authors' 1987 study, there was a significant relationship between expressive communication skills and behavior difficulties - the more limited a teenager's expressive language ability, the more likely he or she is to have behavior difficulties. The implication here is that at least some difficult behaviors are the teenager's way of communicating when he/she does not have the language to do so. In addition, some behaviors may be the result of the frustration that arises when an individual is not understood.
Has inclusion achieved what we hoped for?
We stated at the beginning of the article that we hoped that included children would be more likely to have friends in the neighborhood and better social lives as teenagers, with better social independence skills for getting around their communities, more friends and more involvement in clubs and activities, that their speech, language, behavior and social development would benefit from being with typically developing peers and that their academic achievements would improve, when compared with the teenagers receiving special education in segregated schools. Does the evidence demonstrate these benefits? The answer is "yes" for spoken language, behavior, social development and academic benefits and "no" for the social inclusion benefits.
The language and academic benefits were greater than we expected. The big gains for the included teenagers were for expressive language, literacy and, to a lesser degree, numeracy and general academic attainments. The average gain for expressive language was 2 years and 6 months and for literacy, 3 years and 4 months. These age-related scores are based on norms for typically developing children who are expected to progress 12 months on the measures in a school year. Children with Down syndrome usually progress about 4-5 months on these measures in a year - they are making progress but at a slower rate than typical children. Therefore, considered in relation to expected gains, the teenagers in mainstream school have gained the equivalent of 5-6 years progress in spoken language and literacy when compared to the teenagers educated in special classrooms.
There were some gains in social development and behavior. The teenagers in mainstream schools were more socially mature, with more age-appropriate social behavior and more social confidence. However, the social inclusion gains were not as great as we expected. On the standardised measures there were no gains for the included teenagers and the suggestion of a disadvantage. There were no significant differences in social independence skills, social contacts, leisure activities and community inclusion. Parents were as concerned about the social isolation of their teenagers as they had been in 1987, even though there was evidence of some improvements for everyone since that time.
The benefits of having daily contact with typically developing children and teenagers in the local area, during the school day, did not result in more inclusion and friendships during the teenage years. In addition, the included teenagers seemed to be less likely to have special friends, boyfriends or girlfriends and a social life of their own in their late teens, perhaps as the result of having less contact with peers with similar intellectual disabilities or peers with Down syndrome in school.
What are the implications for parents and for teachers?
1. That all children with Down syndrome should be educated within mainstream classrooms to ensure that they are able to develop their speech and language to the level that is optimal for each child.
The importance of speech and language development for cognitive and social development cannot be over emphasized. Words and sentences are the building blocks for mental development - we think, reason and remember using spoken language, either silently 'in our minds' or aloud to others. Words provide the main source of knowledge about our world.
Any child with speech and language delay will have mental delay (unless a signing baby in a deaf signing family, when sign will be as good as speech for mental development). In addition, speech and language skills influence all aspects of social and emotional development - the ability to negotiate the social world and to make friends, share worries and experiences and be part of the family and community.
2. That all children with Down syndrome should be educated in mainstream classroom to learn alongside their peers and to access the academic curriculum adapted to their individual rate of progress.
Full inclusion in the curriculum leads to much better literacy and numeracy skills, and general knowledge. The level of supported literacy experience across the curriculum also provides an important support for spoken language development.
3. Our research indicates that it is not possible to provide a maximally effective learning environment in a special education classroom.
Children with Down syndrome need to learn with their non-disabled peers with the necessary individual support to make this successful.
4. The social aspects of inclusion need to be addressed.
Children with Down syndrome in mainstream schools need more opportunities to socialise with a peer group of children with similar levels of intellectual disability. This can be achieved by closing special schools and classes and including all children with learning disabilities in mainstream school communities - at present many children who would provide this peer group in the UK are still in special schools. The children with Down syndrome have had a parent lobby and more of them are fully included than their peers with similar levels of intellectual disability. It can also be achieved out of school, by ensuring that children with Down syndrome have friends with similar disabilities out of school.
5. Friendships with non-disabled peers need more support within school communities.
Teachers and parents need to do more to ensure that these friendships carry on outside school. We wish to see an improvement in understanding and support for teenagers and adults with Down syndrome in their homes, workplaces, shops and leisure activities as a result of inclusion. This is not yet happening and needs to be addressed within schools.
These are statements supported by the evidence, and the evidence of earlier reviews of the benefits of inclusion. [11] No study has provided evidence for any educational advantages of special education, only disadvantages, and the practical daily living and social skills are as good or better in mainstream education. The only benefit seems to be contact with a peer group of similar disability - and, considering the significant disadvantages of special education, that need is better met out of school, and in better planned inclusion.
Our conclusions are uncompromising and if we are to achieve the full benefits of inclusive education for all our children we need to implement effective support and training programs. We may also need some variety of provision. Most children with Down syndrome will benefit from the full classroom inclusion that we describe, supported by a learning support team. In many schools, a learning resource area which provides for small group work is needed for some children and can provide a place to meet the peer group with similar levels of intellectual disability.
If we include all children with Down syndrome and all children with intellectual disabilities, then some children may benefit from being in a resourced school. For those children with the greatest levels of disabilities, planning and providing for them may be best done within a specifically resourced school. This does not mean being educated in a special class or resource room - it means that we concentrate skills and human resources in some schools to develop the necessary expertise for successful inclusion of those with the greatest needs. It also means that the children have access to a similar ability peer group as well as benefiting from being included in the mainstream community.
There can be no single prescription for successful inclusion as the school systems in different countries and communities vary widely. The way to move towards full inclusion may be different in different communities and, importantly, different models may work equally well if the attitudes of the school community towards inclusion are positive and the aim is to seek the full inclusion of the child into the social and educational world of the school, while also meeting his or her learning and developmental needs.
Postscript
Some critics of our work have suggested that inclusion in Hampshire is 'special' and only successful because the charity staff support the schools. In fact, from 1988, the teachers and the charity's psychologists learned together year by year. It was the teachers in the schools who showed us how to make inclusion successful. We did not visit more than once a term on average, unless asked to help with a problem. We did not start workshops on inclusion for teachers until 1993 and they were based on sharing what we were learning from the teachers. The children in the study differ widely in ability, behavior, social needs and family backgrounds. The children studied have been spread through some 25 primary schools (infant and junior) and some 12 secondary schools, in inner city, urban and rural areas - these schools are likely to be representative of schools across the UK.
For the past 9 years, we have been running training for inclusion throughout the UK and across the world and we see many, many examples of similarly successful inclusion everywhere. Our schools experienced problems at times, like all schools developing inclusion, but the positive staff attitudes towards inclusion and the support of the Education Authority meant that problems were solved - not seen as a reason to move a child to a special school. At transition points from infant to junior to secondary it was assumed that the children would stay in the mainstream system and everyone planned accordingly. On the basis of parental choice two teenagers moved to MLD provision for secondary education and two moved to mainstream from MLD at this point!
It may be important to note that these teenagers were included before the introduction of IEPs (Individual Education Plans) or SENCOs (Special Educational Needs Co-ordinators) into UK schools. Schools are much better resourced to succeed now - though we do need to be sure that too much planning and special needs expertise does not result in lowered expectations.
We asked teachers to fully include the children in the class activities and told them we would help them to adapt once it was necessary. The children tended to surprise us all and fewer adaptations were needed in infant school than we had anticipated. There is the danger that an IEP could reduce expectations, depending on who writes it and their experience of working with children with Down syndrome in education. The children in this study also had no signing in their classrooms and, at first, no speech and language therapy service. They had to cope and make themselves understood in a spoken language environment and we encouraged teachers to use reading activities to develop their spoken language. We have no way of knowing how much this contributed to their significant speech and language gains, but we are very cautious about the current widespread use of symbols and signing in primary school years - for some children it is necessary and appropriate but not for all just because they have Down syndrome.
You might sum up our approach as focusing on children first - seeing children with Down syndrome as full members of the class and community and playing down differences. They do have special needs and teachers need to know how to address these but we still need to change public and professional attitudes so that they really do treat our children as children first. When we achieve this, we will really see the full benefits of inclusion.
References
- Buckley, S. & Sacks, B. (1987) The Adolescent with Down Syndrome: Life for the Teenager and for the Family. Portsmouth, UK: Portsmouth Polytechnic.
- Buckley, S.J., Bird, G., Sacks, B. & Archer, T. (2006). A comparison of mainstream and special school education for teenagers with Down syndrome: effects on social and academic development. Down Syndrome Research and Practice, 9(3), 51-67. [Read Online]
- Sparrow, S.S., Balla, D.A. & Cicchetti, D.V. (1984). Vineland Adaptive Behaviour Scale. Minnesota, USA: American Guidance Service.
- Conners, C.K. (1997). Conners Rating Scales-Revised. Toronto, Canada: Multi-Health Systems Inc.
- Chapman, R.S. (1997). Language development. In S.M. Pueschel & M. Sustrova, (Eds.) Adolescents with Down Syndrome: Towards a More Fulfilling Life ( pp. 99-110). Baltimore, USA: Paul H. Brookes Publishing.
- Gunn, P. & Crombie, M. (1996). Language and speech. In B. Stratford & P. Gunn, (Eds.) New Approaches to Down Syndrome ( pp. 249-267). London, UK: Cassell.
- Fowler, A. (1999). The challenge of linguistic mastery. In T.J. Hassold & D. Patterson, (Eds.) (1999) Down Syndrome: A Promising Future Together ( pp. 165-184) . New York, USA: Wiley-Liss.
- Chapman, R.S. (2001). Language, cognition, and short-term memory in individuals with Down syndrome. Down Syndrome Research and Practice, 7 (1), 1-7. [Read Online]
- Cuskelly, M. & Gunn, P. (1997). Behaviour concerns. In Pueschel, S.M. & Sustrova, M. (Eds.) Adolescents with Down Syndrome: Towards a More Fulfilling Life ( pp 111-128) . Baltimore, USA: Paul H. Brookes Publishing.
- Stores, R., Stores, G., Fellows, B. & Buckley, S. (1998). Daytime behavior problems and maternal stress in children with Down syndrome, their siblings, and non-intellectually disabled and other intellectually disabled peers. Journal of Intellectual Disability Research. 42 (3) 228-237.
- Cunningham, C. C., Glenn, S., Lorenz, S., Cuckle, P. & Shepperdson, B. (1998). Trends and outcomes in educational placements for children with Down syndrome. European Journal of Special Needs Education, 13(3), 225-237.
Appendix 1
Key to the groups referred to in the data tables
1999T = total 1999 sample 1999M = mainstream group in 1999 sample 1999ST = total special school group in 1999 sample
1987S = total 1987 sample 1999S = special school group used in mainstream/special comparisons
The study groups - total samples or the two cohort studies, 1987 and 1999
| Gender | 1999T (N=46) | 1987S (N=90) |
|---|---|---|
| Girls | 20 (44%) | 40 (44%) |
| Boys | 26 (56%) | 50 (56%) |
Table 1.1 Overall gender distribution
No significant differences in overall gender distribution.
| Age group in years | 1999T (N=46) | 1987S (N=90) |
|---|---|---|
| 1. 11 to 13:11 | 15 (33%) | 46 (51%) |
| 2. 14 to 17:11 | 19 (41%) | 40 (44%) |
| 3. 18 to 20 | 12 (26%) | 4 (5%) |
Table 1.2 Overall age distribution
Significant differences in age group distributions for 1999T and 1986S, using Pearson Chi-Square Test, (c 2 =14.512; df=2; p =0.001). There are more older children in the 1999 sample - possibly the result of the introduction of screening and termination in this locality during the 1980s leading to a fall in the birthrate, reflected in the youngest age group.
| Social class | 1999T (N=45) | 1987S (N=83) |
|---|---|---|
| I +II | 17 (38%) | 25 (30%) |
| III | 20 (44%) | 35 (42%) |
| IV + V | 8 (18%) | 23 (28%) |
Table 1.3 Overall social class distribution
No significant differences in overall social class distribution.
| Family position | 1999T (N=46) | 1987S (N=84) |
|---|---|---|
| Youngest | 20 (43%) | 45 (54%) |
| Middle | 15 (33%) | 10 (12%) |
| Oldest | 9 (20%) | 21 (25%) |
| Only | 2 (4%) | 8 (9%) |
Table 1.4 Overall position in family
Significant differences in overall family position between 1999T and 1986S using Pearson Chi-Square Test, (c 2 =8.646; df=3; p =0.034). There are more youngest and fewer middle children in 1987S - but no difference in proportions of oldest and only children (who tend to progress faster, see Buckley and Sacks 1997).
Appendix 2
Sample data for the subgroups used in analyzes
| Gender | 1999M | 1999S | 1999ST | 1987S |
|---|---|---|---|---|
| Girls | 10 (56%) | 9 (39%) | 10 (36%) | 40 (44%) |
| Boys | 8 (44%) | 14 (61%) | 18 (64%) | 50 (56%) |
| Total | 18 | 23 | 28 | 90 |
Table 2.1 Numbers and gender distribution
No significant differences in male-female distributions between any groups.
| Mean age | 1999M N=18 | 1999S N=23 | 1999ST N=28 | 1987S N=90 |
|---|---|---|---|---|
| 176.50 (33.35) | 196.39 (31.08) | 200.75 (30.70) | 170.41 (24.87) |
Table 2.2 Mean age of groups
A one-way ANOVA for independent groups was performed, and significant differences between the mean age of the groups was found, (F =8.318; df=2; p <0.001).
1999M are significantly younger than 1999S, (p =0.053). 1999ST are significantly older than 1987S, (p <0.001). No significant differences between 1999M and 1987S.
| Age group in years | 1999M | 1999S | 1999ST | 1987S |
|---|---|---|---|---|
| 1 11 to 13:11 | 10 (55%) | 5 (22%) | 5 (18%) | 46 (51%) |
| 2 14 to 17:11 | 5 (28%) | 11 (48%) | 14 (50%) | 40 (44%) |
| 3 18 to 20 | 3 (17%) | 7 (30%) | 9 (32%) | 4 (4%) |
| Total | 18 | 23 | 28 | 90 |
Table 2.3 Age distribution
Significant differences in age group distributions, for 1999M, 1999ST & 1987S, using Pearson Chi-Square Test, (c 2 =21.462; df=4; p <0.001) There are more younger children in 1999M.
Significant differences in age group distributions, for 1999M, 1999S & 1987S, using Pearson Chi-Square Test, (c 2 =17.176; df=4; p =0.002) There are more older children in 1999S.
| Gender and Age group | 1999M | 1999S | 1987S |
|---|---|---|---|
| Girls aged 11 to 13:11 | 5 (50%) | 3 (33%) | 18 (45%) |
| Boys aged 11 to 13:11 | 5 (62%). | 2 (14%) | 28 (56%) |
| Girls aged 14 to 17:11 | 2 (20%) | 4 (45%) | 22 (55%) |
| Boys aged 14 to 17:11 | 3 (38%) | 7 (50%) | 18 (36%) |
| Girls aged 18 to 20 | 3 (30%) | 2 (22%) | -- |
| Boys aged 18 to 20 | -- | 5 (36%) | 4 (8%) |
Table 2.4 Gender and age distributions
Significant differences in age group distributions for females, using Pearson Chi-Square Test, (c2 = 13.273; df=4; p =0.010), and significant differences in age group distributions for males, using Pearson Chi-Square Test, (c2 = 12.674; df=4; p =0.013). In the youngest age bands, there is a greater percentage of boys and girls in mainstream settings (1999M). In the middle age band there is a greater percentage of boys and girls in special school (1999S). There are no boys in the oldest mainstream group.
| Social class | 1999M | 1999S | 1999ST | 1987S |
|---|---|---|---|---|
| I +II | 6 (33%) | 10 (45%) | 11 (41%) | 25 (30%) |
| III | 8 (45%) | 9 (41%) | 12 (44%) | 35 (42%) |
| IV =V | 4 (22%) | 3 (14%) | 4 (15%) | 23 (28%) |
| Total | 18 | 22 | 27 | 83 |
Table 2.5 Social class distribution
No significant differences in social class distributions between any groups.
| Mean age at birth | 1999M N=18 | 1999S N=23 | 1999ST N=28 | 1987S N=90 |
|---|---|---|---|---|
| Mothers | 31.44 (4.49) | 32.00 (5.04) | 32.14 (5.12) | 32.00 (8.58) |
| Fathers | 34.35 (6.99) | 32.45 (4.62) | 32.60 (4.49) | 34.30 (8.61) |
Table 2.6 Parents age at time of birth
No significant differences in parents age at time of birth between any groups.
| Family position | 1999M | 1999S | 1999ST | 1987S |
|---|---|---|---|---|
| Youngest | 7 (39%) | 12 (52%) | 13 (46%) | 45 (54%) |
| Middle | 6 (33%) | 6 (26%) | 9 (32%) | 10 (12%) |
| Oldest | 4 (22%) | 5 (22%) | 5 (18%) | 21 (25%) |
| Only | 1 (6%) | - | 1 (4%) | 8 (9%) |
| Total | 18 | 23 | 28 | 84 |
Table 2.7 Family position of child with Down syndrome
No significant differences in family position of child with Down syndrome between the groups
Appendix 3
Vineland Domains - Age equivalent scores in months. Means and (standard deviation)
| Age group in years | 1999M (N=17) | 1999S (N=22) |
|---|---|---|
| 1 11 to 13:11 | 64.70 (7.86) | 51.60 (12.32) |
| 2 14 to 17:11 | 82.75 (21.47) | 68.40 (29.27) |
| 3 18 to 20 | 109.33 (35.91) | 111.00 (48.27) |
| Total | 76.82 (24.10) | 78.13 (40.43) |
Table 3.1 Vineland Total Daily Living Skills
A two-way ANOVA for independent groups was performed on the Vineland scores to investigate the effects of school placement and age group, a significant main effect of age group was found for the Total Daily Living Skills, (F 2.33 = 8.612; p =0.001). No significant effect of school placement was found.
| Age group in years | 1999M (N=17) | 1999S (N=22) |
|---|---|---|
| 1 11 to 13:11 | 61.80 (9.96) | 46.80 (22.70) |
| 2 14 to 17:11 | 74.50 (21.46) | 78.90 (56.44) |
| 3 18 to 20 | 119.33 (42.44) | 128.86 (46.33) |
| Total | 74.94 (29.06) | 87.50 ( 55.46) |
Table 3.2 Vineland Total Socialisation Skills
A two-way ANOVA for independent groups was performed on the Vineland age equivalent scores to investigate the effects of school placement and age group, a significant main effect of age group was found for Total Socialisation Skills, (F 2.33 = 8.424; p =0.001). No significant effect of school placement was found.
Appendix 3 (continued)
| Age group in years | 1999M (N=17) | 1999S (N=22) |
|---|---|---|
| 1 11 to 13:11 | 74.70 (26.12) | 51.00 (17.66) |
| 2 14 to 17:11 | 83.00 (20.61) | 41.50 (8.40) |
| 3 18 to 20 | 151.33 (50.93) | 66.43 (21.56) |
| Total | 90.17 (40.63) | 51.59 (18.56) |
Table 3.3 Vineland Total Communication Age
A two-way ANOVA for independent groups found a significant main effect of school, (F 1.33 = 38.236; p <0.001), and a significant main effect of age group, (F 2.33 = 12.855; p <0.001), and a significant interaction between school placement and age group, (F 2.33 = 4.673; p =0.016) for total communication age. There was not consistent progress for age in special school groups.
Appendix 4
Vineland Daily Living sub-Domain scores - Age equivalent scores in months. Means and (standard deviation)
| Age group in years | 1999M (N=17) | 1999S (N=22) |
|---|---|---|
| 1 11 to 13:11 | 60.20 (17.35) | 52.20 (18.71) |
| 2 14 to 17:11 | 88.50 (36.16) | 89.80 (56.83) |
| 3 18 to 20 | 146.67 (39.72) | 121.71 (55.27) |
| Total | 82.12 (41.27) | 91.41 (54.74) |
Table 4.1 Vineland Domestic Daily Living Skills
| Age group in years | 1999M (N=17) | 1999S (N=22) |
|---|---|---|
| 1 11 to 13:11 | 72.10 (13.10) | 57.40 (10.48) |
| 2 14 to 17:11 | 79.50 (18.81) | 62.60 (14.17) |
| 3 18 to 20 | 105.00 (48.28) | 122.86 (59.96) |
| Total | 79.65 (24.70) | 80.59 (44.85) |
Table 4.2 Vineland Community Daily Living Skills
| Age group in years | 1999M (N=17) | 1999S (N=22) |
|---|---|---|
| 1 11 to 13:11 | 64.20 (20.72) | 48.00 (12.98) |
| 2 14 to 17:11 | 79.25 (13.50) | 73.80 (53.14) |
| 3 18 to 20 | 91.00 (11.79) | 85.14 (28.23) |
| Total | 72.47 (20.29) | 71.54 (40.81) |
Table 4.3 Vineland Personal Daily Living Skills
Two-way ANOVAs for independent groups were performed on the Vineland scores to investigate the effects of school placement and age group, a significant main effect of age group was found for the Domestic Daily Living Skills, (F 2.33 = 8.846; p =0.001), and for the Community Daily Living Skills, (F 2.33 = 7.258; p =0.002). The scores progress with age for each of these measures. For the Personal Daily Living Skills there were no significant differences. There was no main effect of school placement.
Appendix 5
Vineland Socialisation sub-Domain scores - Age equivalent scores in months. Means and (standard deviation)
| Age group in years | 1999M (N=17) | 1999S (N=22) |
|---|---|---|
| 1 11 to 13:11 | 75.90 (15.12) | 50.80 (31.06) |
| 2 14 to 17:11 | 58.50 (11.62) | 84.90 (58.66) |
| 3 18 to 20 | 87.67 (38.48) | 175.71 (33.30) |
| Total | 73.88 (20.88) | 106.04 (67.33) |
Table 5.1 Vineland Interpersonal Relationships
| Age group in years | 1999M (N=17) | 1999S (N=22) |
|---|---|---|
| 1 11 to 13:11 | 59.20 (18.41) | 43.20 (23.09) |
| 2 14 to 17:11 | 64.25 (18.39) | 66.90 (60.48) |
| 3 18 to 20 | 136.33 (71.18) | 114.86 (48.49) |
| Total | 74.00 (42.14) | 76.77 (56.03) |
Table 5.2 Vineland Play and Leisure Time
Appendix 5 (continued)
| Age group in years | 1999M (N=17) | 1999S (N=22) |
|---|---|---|
| 1 11 to 13:11 | 67.60 (9.90) | 51.20 (30.31) |
| 2 14 to 17:11 | 105.75 (46.33) | 91.20 (60.47) |
| 3 18 to 20 | 137.67 (19.30) | 115.86 (56.54) |
| Total | 88.94 (36.12) | 89.95 (56.90) |
Table 5.3 Vineland Coping Skills
Two-way ANOVAs for independent groups were performed on the Vineland age equivalent scores to investigate the effects of school placement and age group, a significant main effect of age group was found for Interpersonal Relationships, (F 2.33 = 9.327; p =0.001), Play and Leisure Time, (F 2.33 = 7.831; p =0.002), Coping Skills, (F 2.33 = 6.373; p =0.005), and Total Socialisation Skills, (F 2.33 = 8.424; p =0.001). For Interpersonal Relationships, a significant main effect of school placement was found, (F 1.33 = 4.987; p =0.032) and a significant interaction between age group and school placement, (F 2.33 = 5.842; p =0.007).
Appendix 6
Vineland Communication sub-Domain scores - Age equivalent scores in months. Means and (standard deviation)
| Age group in years | 1999M (N=17) | 1999S (N=22) |
|---|---|---|
| 1 11 to 13:11 | 68.50 (22.18) | 60.40 (19.35) |
| 2 14 to 17:11 | 71.25 (26.27) | 61.40 (23.36) |
| 3 18 to 20 | 81.67 (21.36) | 75.71 (22.93) |
| Total | 71.47 (22.09) | 65.72 (22.46) |
Table 6.1 Vineland Receptive Language Age
A two-way ANOVA for independent groups showed no significant effects of school placement or age for receptive language age.
| Age group in years | 1999M (N=17) | 1999S (N=22) |
|---|---|---|
| 1 11 to 13:11 | 51.00 (22.70) | 34.20 (6.30) |
| 2 14 to 17:11 | 59.25 (16.56) | 33.80 (5.01) |
| 3 18 to 20 | 139.33 (80.83) | 49.14 (11.07) |
| Total | 68.53 (48.07) | 38.77 (10.29) |
Table 6.2 Vineland Expressive Language Age
A two-way ANOVA for independent groups found a significant main effect of school, (F 1.33 = 26.161; p <0.001), and a significant main effect of age group, (F 2.33 = 13.158; p <0.001), and a significant interaction between school placement and age group, (F 2.33 = 6.439; p =0.004) for expressive language age.
| Vineland Age Equivalents | 1999M Girls (N=10) | 1999M Boys (N=7) | 1999S Girls (N=8) | 1999S Boys (N=14) |
|---|---|---|---|---|
| Receptive Com | 81.10 (20.91) | 57.71 (16.45) | 67.88 (21.84) | 64.50 (23.53) |
| Expressive Com | 86.30 (56.10) | 43.14 (12.84) | 40.13 (9.03) | 38.00 (11.20) |
| Written Com | 126.20 (35.87) | 84.00 (31.90) | 75.25 (22.57) | 65.00 (25.23) |
| Total Vineland Communication | 108.90 (41.09) | 63.43 (21.24) | 56.88 (19.25) | 48.57 (18.16) |
Table 6.4 Vineland Communication Skills and Gender
A two-way ANOVA for independent groups found a significant main effect of school, for Expressive Communication (F 1.35 = 6.658; p=0.014), Written Communication (F 1.35 = 13.207; p=0.001), and Total Communication (F 1.35 = 14.380; p=0.001), and a significant main effect of sex, for Expressive Communication (F 1.35 = 5.184; p=0.029), Written Communication (F 1.35 = 7.425; p=0.010) and Total Communication (F 1.35 = 9.296; p=0.004). Significant interactions were found between school placement and sex, for Expressive Communication (F 1.35 = 4.256; p=0.047) and Total Communication (F 1.35 = 4.441; p=0.042). No significant main effects were found for Receptive Communication.
| Age group in years | 1999M (N=17) | 1999S (N=22) |
|---|---|---|
| 1 11 to 13:11 | 93.00 (28.86) | 79.40 (17.91) |
| 2 14 to 17:11 | 101.75 (13.77) | 56.00 (19.38) |
| 3 18 to 20 | 171.00 (36.37) | 79.29 (28.11) |
| Total | 108.82 (39.54) | 68.72 (24.27) |
Table 6.3 Vineland Written Language age
A two-way ANOVA for independent groups found a significant main effect of school, (F 1.33 = 33.243; p <0.001), and a significant main effect of age group, (F 2.33 = 9.487; p =0.001), and a significant interaction between school placement and age group, (F 2.33 = 6.454; p =0.004) for written language age.
Appendix 7
Vineland Domain scores - Profile comparison
| Domains | 1999M | 1999S |
|---|---|---|
| Daily Living | 76.82 (24.10) | 78.13 (40.43) |
| Communication | 90.17 (40.63) | 51.59 (18.56) |
| Socialisation | 74.94 (29.06) | 87.50 (55.46) |
Table 7.1 Age equivalent scores
1999S group N = 22. A repeated measures ANOVA showed a significant difference F (2, 42) = 11.99 p <.001
Pairwise comparisons, with Bonferroni adjustment for multiple comparison, showed significant differences p <.01 between communication and both socialisation and daily living skills.
1999M group N = 17. No significant differences between the domain scores. F (2,32) = 4.01 p =<.06.
Appendix 8
Language profiles - receptive, expressive and written language
| 1999T | 1999S | |
|---|---|---|
| Receptive | 71.47 (22.09) | 65.72 (22.46) |
| Expressive | 68.53 (48.07) | 38.77 (10.29) |
| Written | 108.83 (39.54) | 68.72 (24.27) |
Table 8.1
Included teenagers:
Paired sample t tests show that there is no significant difference between the receptive and expressive language scores for this group [t (16) = .288 p= .777]. Their written language scores are significantly better than their receptive [t (16) = - 3.964 p < .001] or expressive scores [t (16) = -5.147 p < .000].
Special school teenagers:
Paired sample t tests show that there is a significant difference between the receptive and expressive language scores for this group [t (22) = 6.276 p < .000]. Their written language scores are significantly better than their expressive scores [t (22) = -6.394 p < .000]. There is no significant difference between their receptive and written language scores [t (22) = -.479 p = .637]
Appendix 9
Buckley and Sacks questionnaire data 1987 and 1999
| B&S Quest. | 1999M (N=18) | 1999S (N=23) | 1999ST (N=28) | 1987S (N=90) |
|---|---|---|---|---|
| Dressing 1 | 19.72 (3.18) | 18.91 (4.74) | 17.79 (5.20) | 17.40 (6.00) |
| Toileting 1,2,4 | 18.89 (1.37) | 18.00 (2.07) | 17.39 (2.56) | 14.30 (3.40) |
| Personal care 1 | 16.17 (3.38) | 14.96 (5.18) | 13.93 (5.59) | 13.10 (5.30) |
| Mealtimes | 38.17 (8.51) | 40.87 (9.39) | 37.86 (12.26) | 39.90 (10.30) |
| Total Daily Living skills | 92.94 (14.56) | 92.73 (19.02) | 86.93 (23.61) | 91.79 (23.90) |
Table 9.1 Daily Living Skills
One-way ANOVAs for independent groups were performed; no significant differences were found in Total Daily Living Skills (B&S) between the groups.
| B&S Quest. | 1999M (N=18) | 1999S (N=23) | 1999ST (N=28) | 1987S (N=90) |
|---|---|---|---|---|
| Communication 1,3 | 16.11 (3.03) | 12.65 (4.79) | 11.54 (5.20) | 12.07 (5.35) |
| Reading 1,3 | 26.56 (3.15) | 14.96 (9.00) | 14.18 (8.93) | 12.01 (10.48) |
Table 9.2 Communication skills
One-way ANOVAs for independent groups were performed, significant differences were found for Communication skills, (F =4.903; df=2; p =0.009), and Reading Skills, (F =17.343; df=2; p <0.001). Post Hoc Tests (Tukey HSD) showed that 1999M scored significantly higher than 1986S (p =0.005) for Communication Skills, and 1999M scored significantly higher than 1999S (p <0.001) and 1986S (p <0.001) for Reading Skills.
| B&S Quest. | 1999M (N=18) | 1999S (N=23) | 1999ST (N=28) | 1987S (N=90) |
|---|---|---|---|---|
| Reading 1,3 | 26.56 (3.15) | 14.96 (9.00) | 14.18 (8.93) | 12.01 (10.48) |
| Writing 1,2,3 | 15.78 (2.60) | 12.65 (2.64) | 12.18 (3.01) | 7.34 (4.79) |
| Arithmetic 1,2,3 | 17.22 (4.47) | 11.30 (6.26) | 10.61 (6.21) | 7.52 (5.69) |
| Money | 10.06 (7.33) | 11.65 (9.00) | 11.18 (8.65) | 8.19 (8.46) |
| General Knowledge 1,3 | 28.06 (5.01) | 20.74 (8.47) | 20.14 (9.07) | 22.40 (10.72) |
| Total School Achievment 1,3 | 97.67 (15.74) | 71.30 (31.16) | 68.29 (31.09) | 57.47 (34.73) |
Table 9.3 Academic Skill
One-way ANOVAs for independent groups were performed, significant differences were found for Reading Skills (F =17.343; df=2; p <0.001), Writing Skills (F =37.578; df=2; p <0.001), Arithmetic (F =23.543; df=2; p <0.001), General Knowledge (F =3.183; df=2; p =0.045), and Total School Achievement (F =12.137; df=2; p <0.001). Reading Skills: Post Hoc Tests (Tukey HSD) showed that 1999M scored significantly higher than 1999S (p <0.001) and 1986S (p <0.001). Writing Skills: Post Hoc Tests (Tukey HSD) showed that 1999M scored significantly higher than 1999S (p =0.051) and 1986S (p <0.001), and 1999S scored significantly higher than 1986S (p <0.001). Arithmetic Skills: Post Hoc Tests (Tukey HSD) showed that 1999M scored significantly higher than 1999S (p =0.002) and 1986S (p <0.001), and 1999S scored significantly higher than 1986S (p =0.012). Money Skills: There were no significant differences between the groups. General Knowledge: Post Hoc Tests (Tukey HSD) showed that 1999M scored significantly higher than 1999S (p =0.046). Total School Achievement: Post Hoc Tests (Tukey HSD) showed that 1999M scored significantly higher than 1999S (p =0.025) and 1986S (p <0.001).
| B&S Quest. (raw scores) | 1999M (N=18) | 1999S (N=23) | 1999ST (N=28) | 1987S (N=90) |
|---|---|---|---|---|
| Social independence | 4.44 (2.23) | 4.61 (4.32) | 4.21 (4.09) | 2.62 (2.90) |
| Social contacts | 13.78 (7.44) | 13.22 (6.14) | 12.12 (6.48) | 10.16 (5.02) |
| Leisure interests | 17.89 (4.09) | 19.52 (4.94) | 18.39 (5.37) | 17.92 (4.66) |
| B&S Total Social Skills | 36.11 (9.82) | 37.35 (11.85) | 34.71 (12.33) | 30.70 (10.05) |
Table 9.4 Social Skills
One-way ANOVAs for independent groups were performed, significant differences were found for Social Independence (F =5.312; df=2; p =0.006), Social Contact (F =4.961; df=2; p =0.008) and B&S Total Social Skills (F =4.971; df=2; p =0.008). No significant differences were found between the groups for Leisure Interests.
Social Independence: Post Hoc Tests (Tukey HSD) showed that 1999S scored significantly higher than 1986S (p =0.018). Social Contact: Post Hoc Tests (Tukey HSD) showed that 1999M scored significantly higher than 1986S (p =0.033) and 1999S scored significantly higher than 1986S (p =0.051). B&S Total Social Skills: Post Hoc Tests (Tukey HSD) showed that 1999S scored significantly higher than 1986S (p =0.016).

